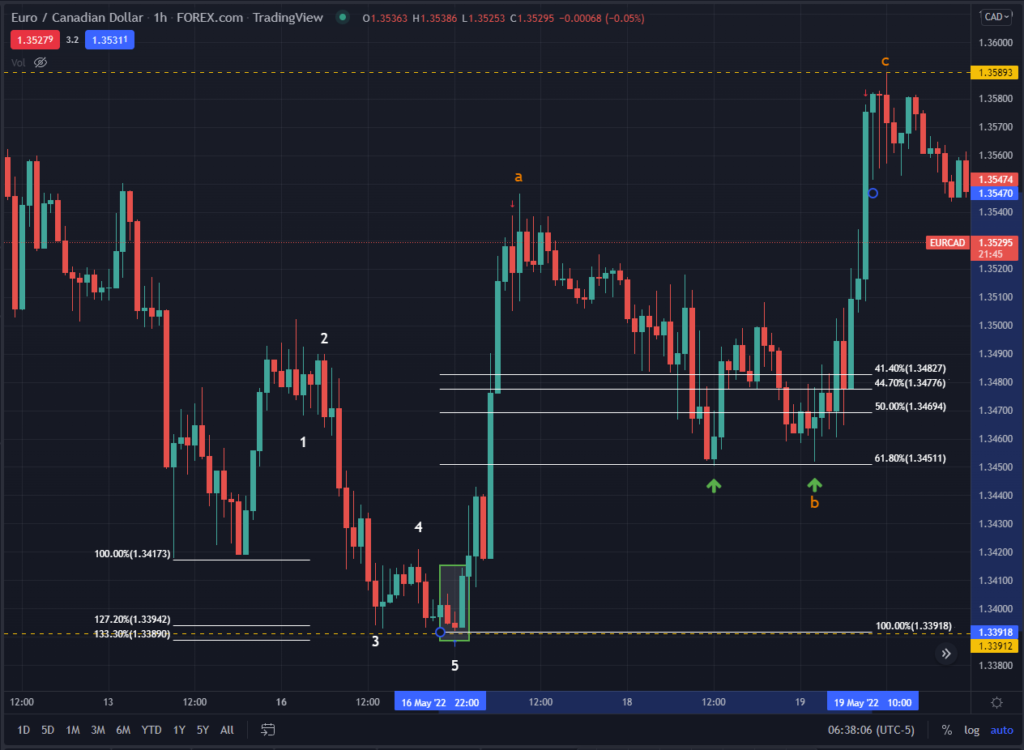
A clean entry is one where you have a number of technical tools showing you that you are at /very near technical support or resistance.
This is an actual trade on EUR/CAD that I placed because it was what I call perfect simple.
If you notice, there’s a blue arrow at the bottom pointing to a red candle – rhat’s where I entered the trade. It’s easy to see in hindsight that it was a good clean entry, especially when your trade hits your anticipated target. But how did I know when I entered?

For me, seeing the clean entry while placing the trade or closing the trade is the same. In this EUR/CAD trade, here are 5 points confirmed my entry:
Classic technical pattern (a double bottom) showing price support
Fibonacci confluence at the double bottom (127.2% retracement)
Elliott wave logic (sub-degree 5-wave pattern ending at the double bottom support)
Candlestick reversal pattern (spinning top + morningstar)
Indicator support confirming the price was likely to reverse trend and move higher, not lower
You don’t have to have all 5 things above–because it takes time to learn/notice them all, but the more non-correlated factors you have showing that you are indeed at a point of reversal in price, the better.
Entering close to resistance/support is how to have a clean entry. The two green arrows in the chart also show great “clean” entries.
My one critique of my trade during my own post trade analysis session was that I didn’t put on an additional position at either one of those after exiting 80% of my original position at the red arrow to the left. Too many traders in leveraged/volatile markets enter much later and subject themselves to bad positions in terms of risk management. Risk is much easier to quantify and manage at support/resistance because you can work with numbers, not feelings.


