53:01
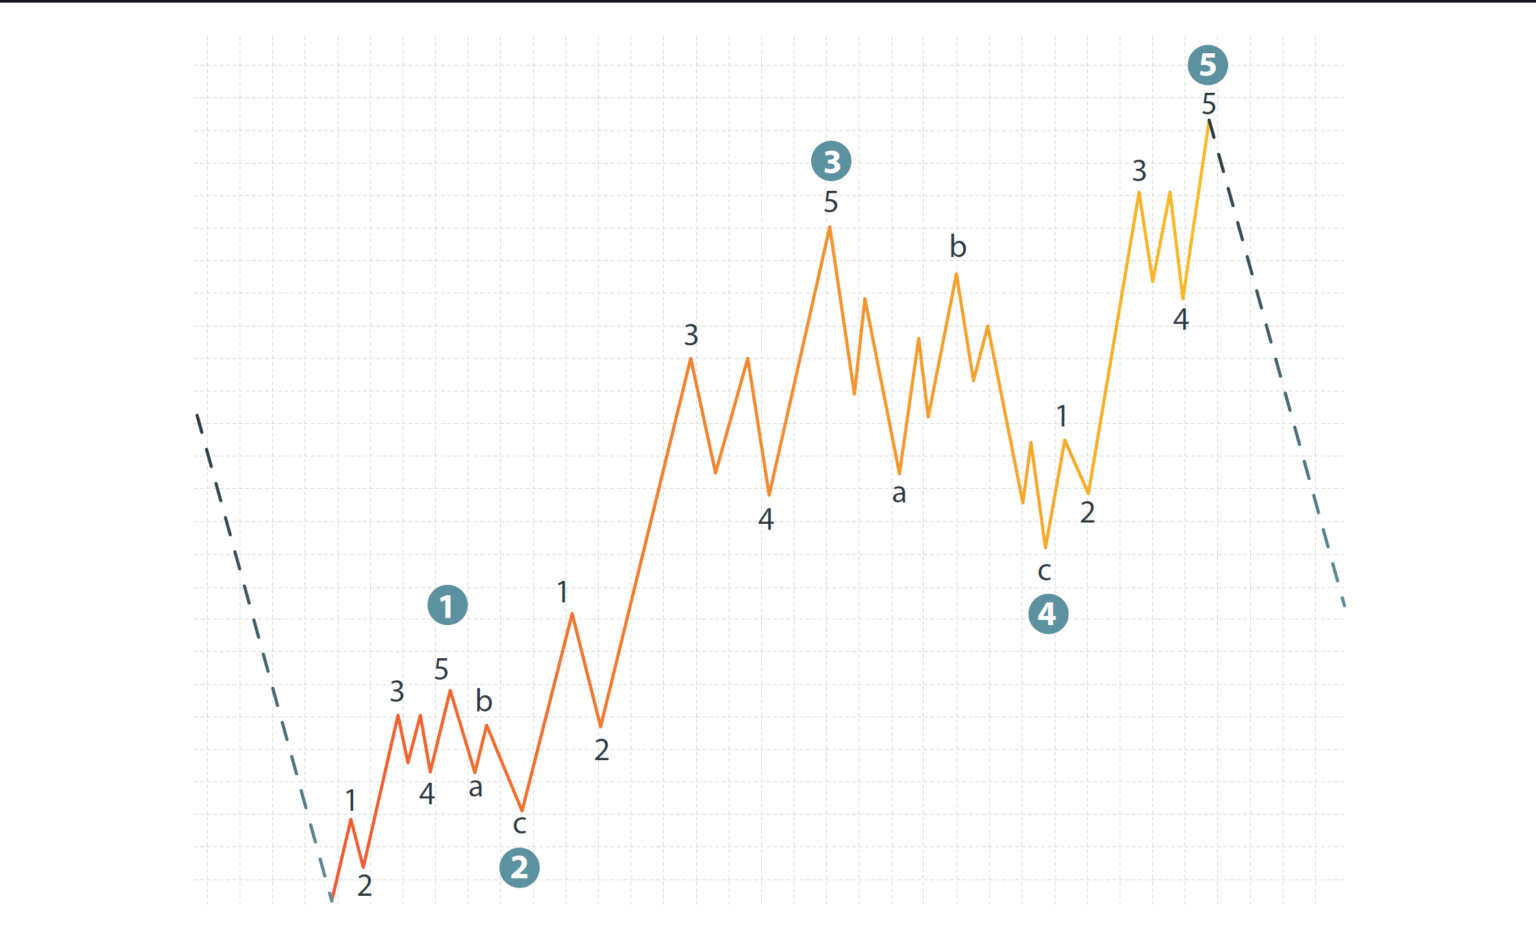
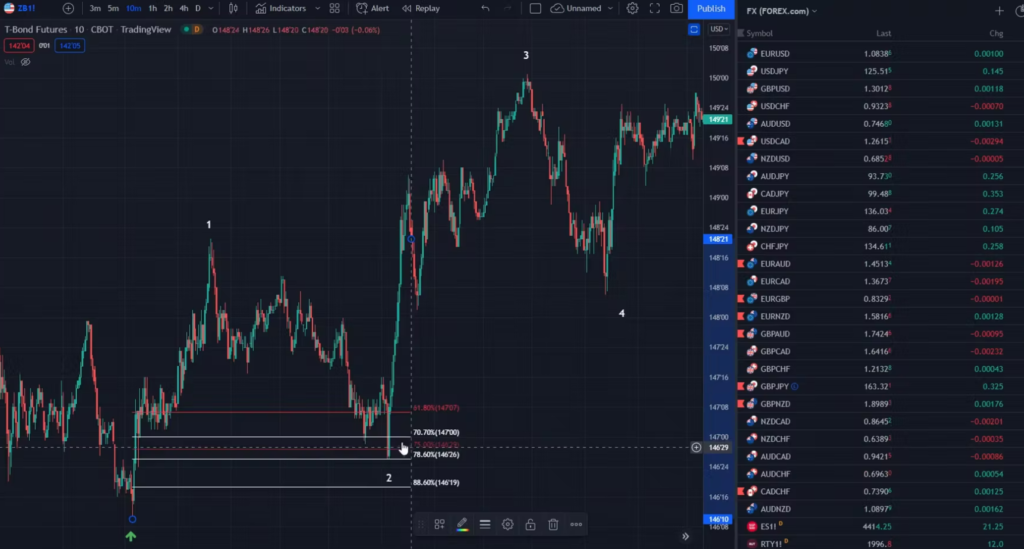
Elliott Wave – ZigZag
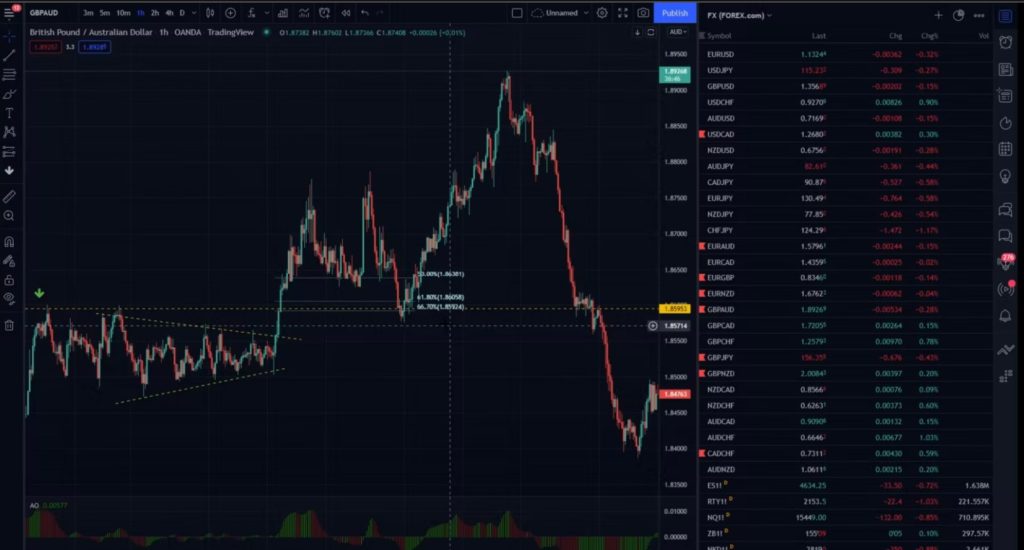
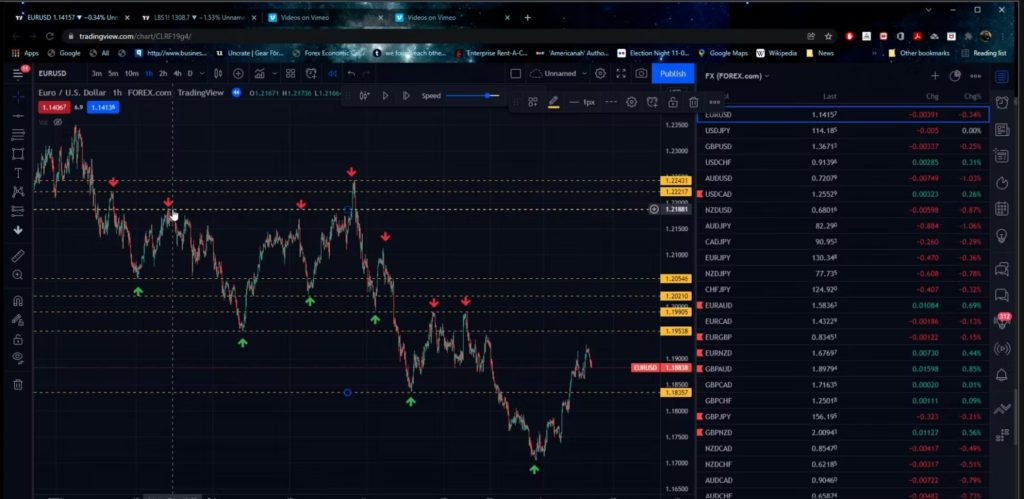
Take a in-depth study at this gem of a corrective pattern - the zigzag. See how it presents trading opportunities to retail traders that are often overlooked

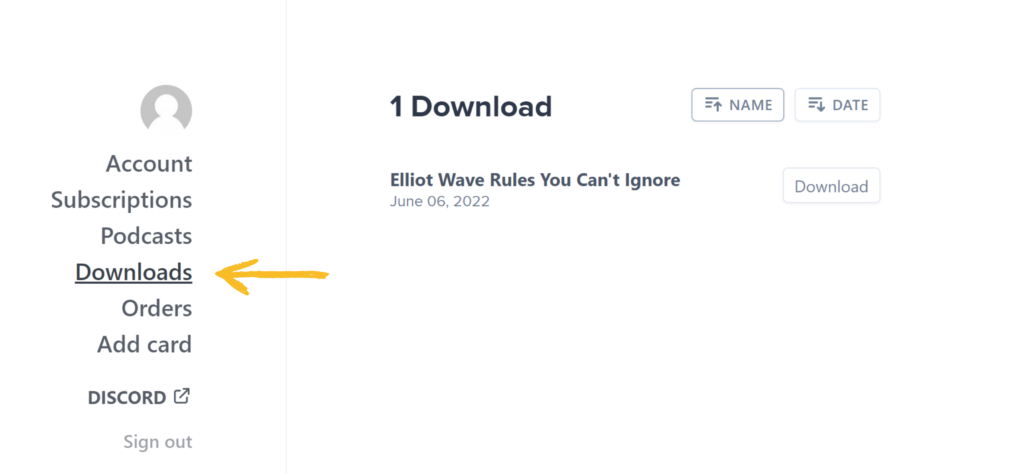
In this lesson, you will learn how to properly setup your chart to identify patterns and take action.
[wpc_completed_content] Lesson Complete[/wpc_completed_content]

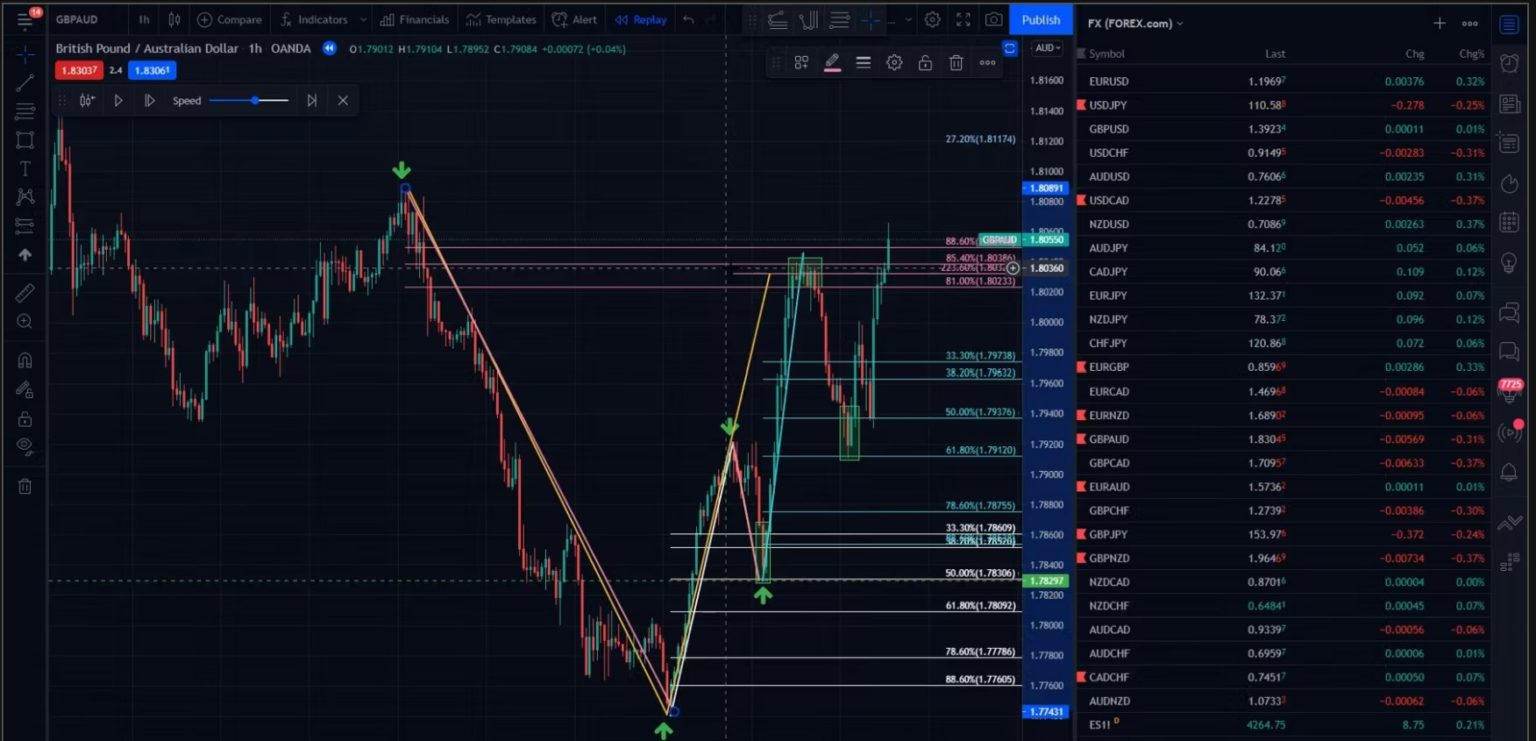
In this lesson we explore how to use Fibonacci Analysis with candlestick patterns and how to find areas of support and resistance.[wpc_completed_content] Lesson Complete[/wpc_completed_content]

Learn about the most practical pattern that every trader should have in their arsenal. If you don’t learn anything else, stop here and make sure you master this pattern. [wpc_completed_content] Lesson Complete[/wpc_completed_content]
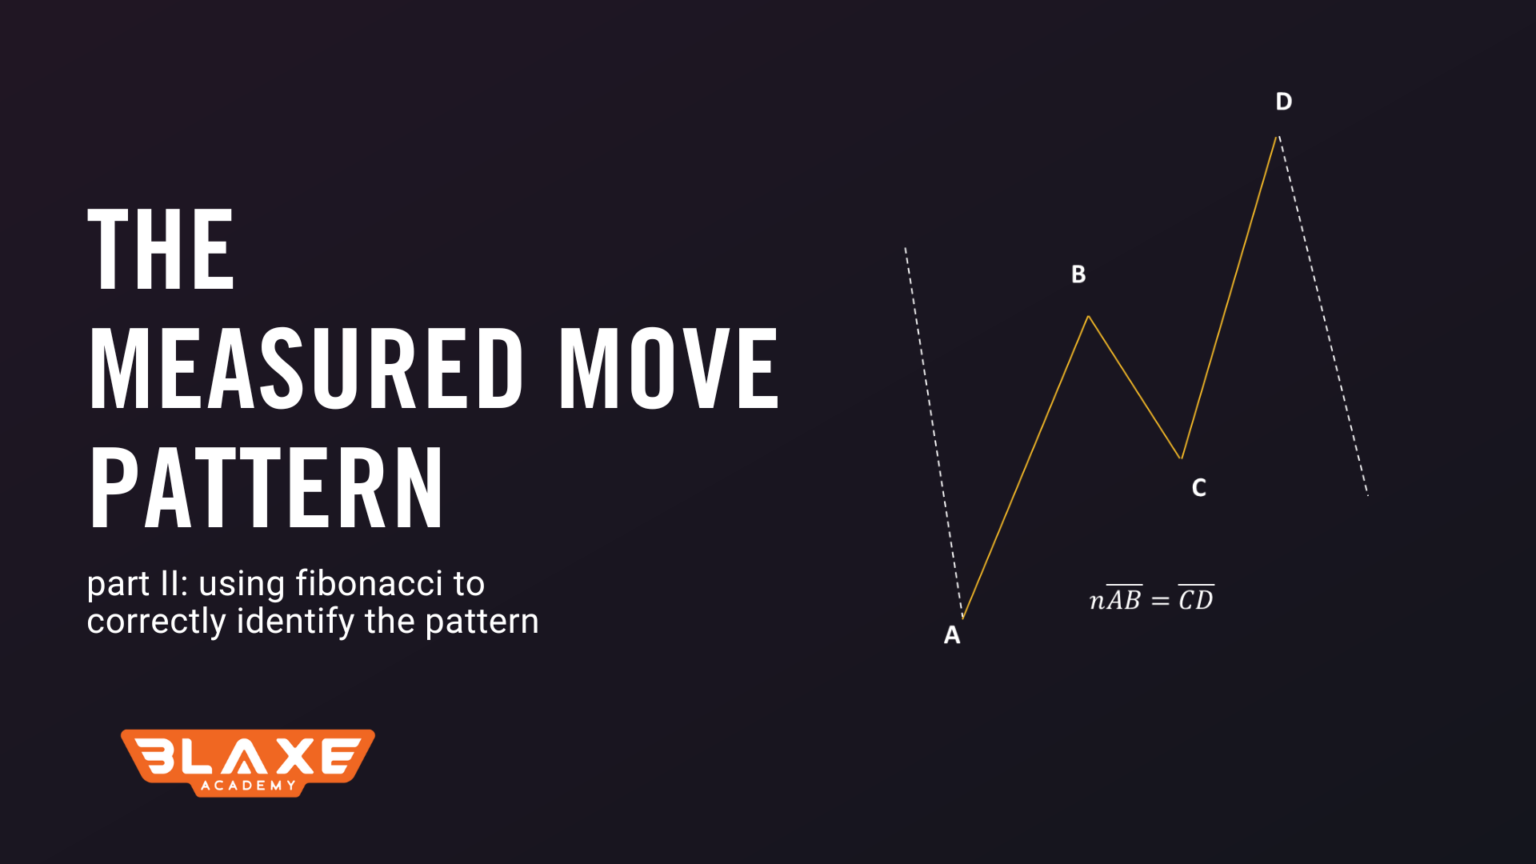
In this session we talk about how to use fibonacci analysis to correctly identify the measured move pattern consistently. Learn how you can see the move that arises from market activity, gauge the pullback and execute. [wpc_completed_content] Lesson Complete[/wpc_completed_content]
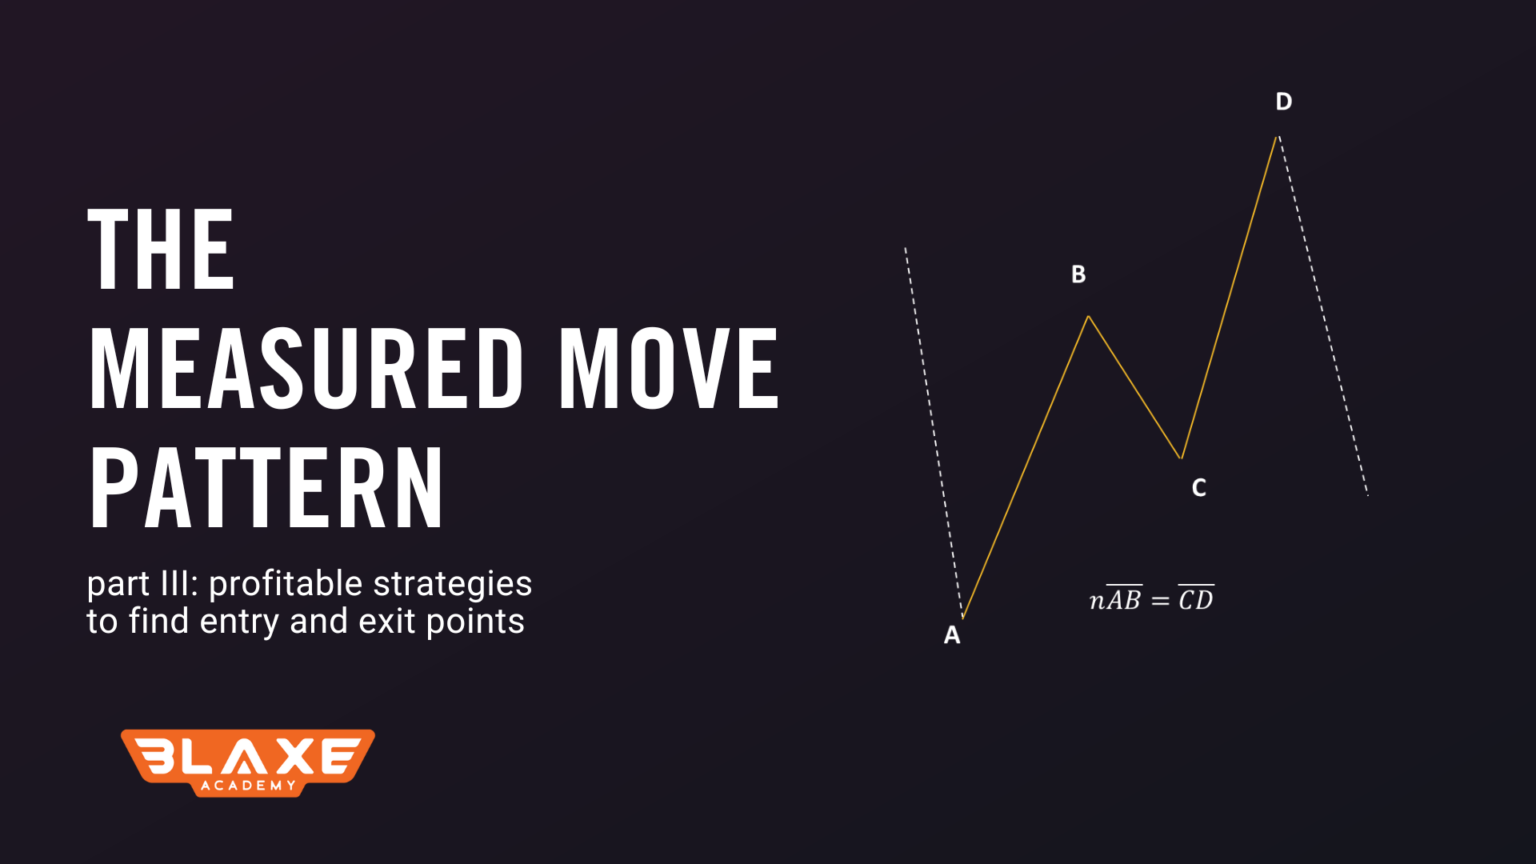
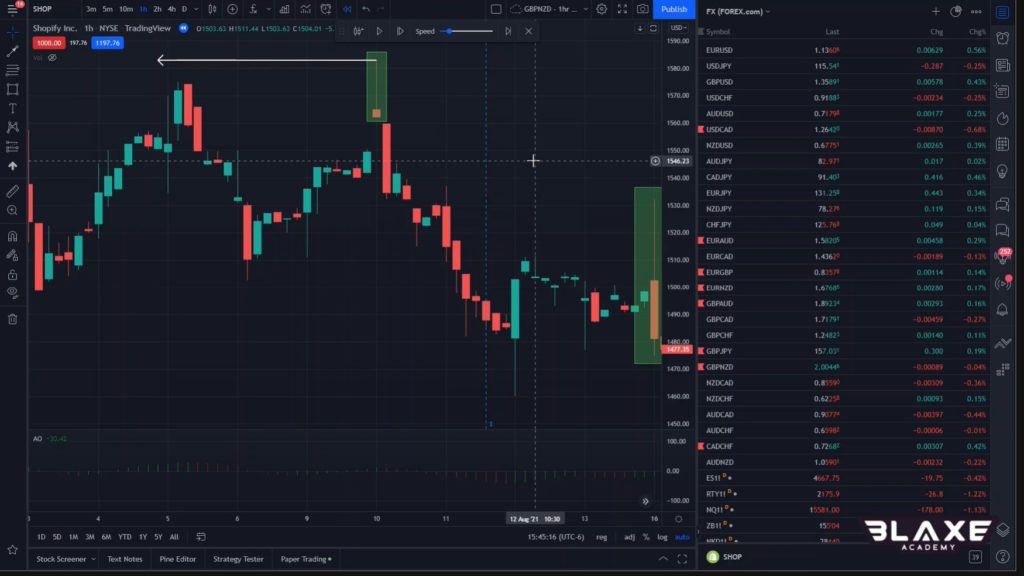
Learn two profitable strategies to set up trades with good risk reward using the measured move pattern. [wpc_completed_content] Lesson Complete[/wpc_completed_content]
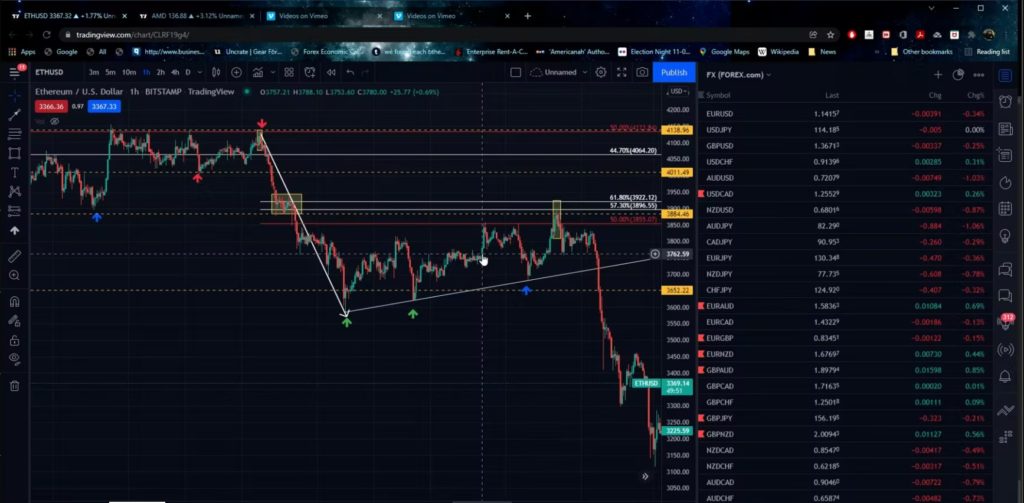
Markets behave in irrational ways, but one way to bring order and probability to your side is to learn and apply Elliott Wave theory. [wpc_completed_content] Lesson Complete[/wpc_completed_content]
In this episode, we show you how to pull it altogether using candlesticks, the measured move, Fibonacci retracements, and Elliott Waves. [wpc_completed_content] Lesson Complete[/wpc_completed_content]
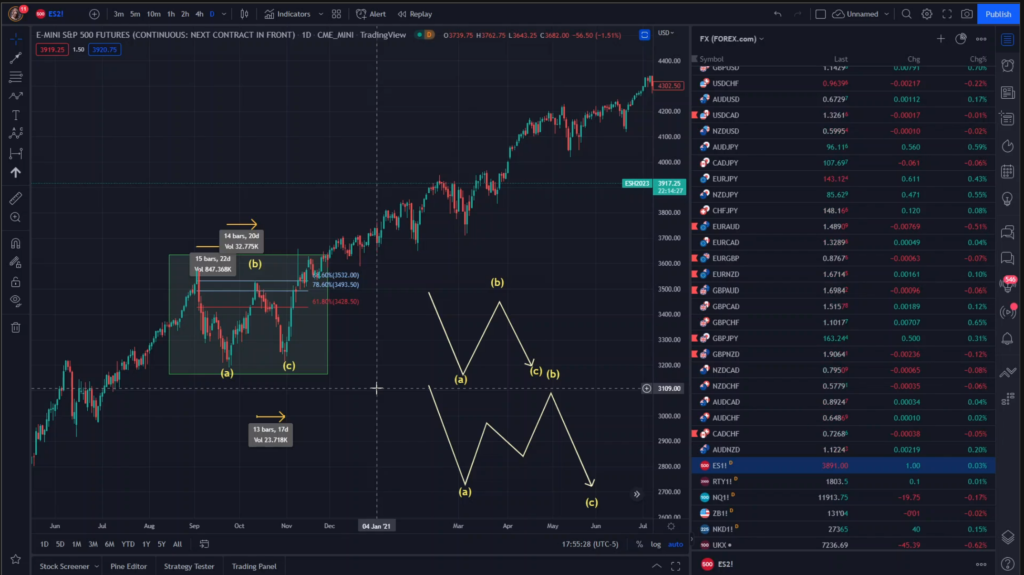
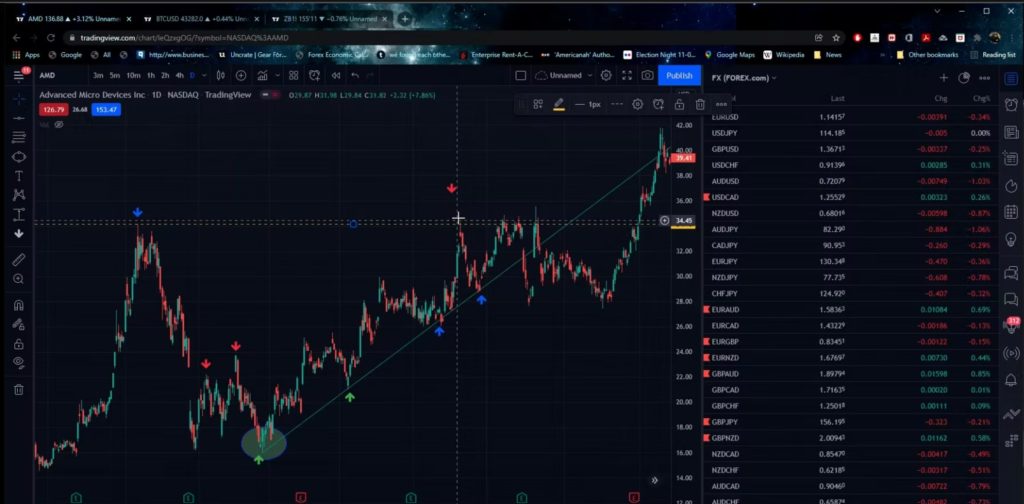
Now that you’re acquainted with the rules of the wave theory, we now look at examples of corrective and impulsive waves in stocks ($SPY) and forex (EUR/USD).[wpc_completed_content] Lesson Complete[/wpc_completed_content]
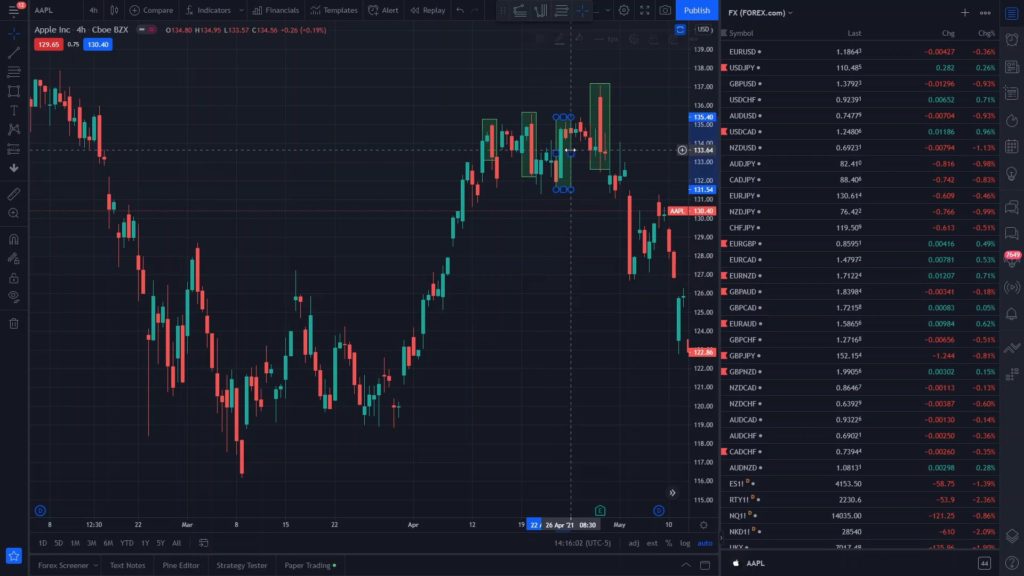
Take a in-depth study at this gem of a corrective pattern - the zigzag. See how it presents trading opportunities to retail traders that are often overlooked
One of the fundamental structures of Elliott Wave analysis is the impulse wave. You may have heard about this before but this video is designed to show you what's really important about impulse waves.
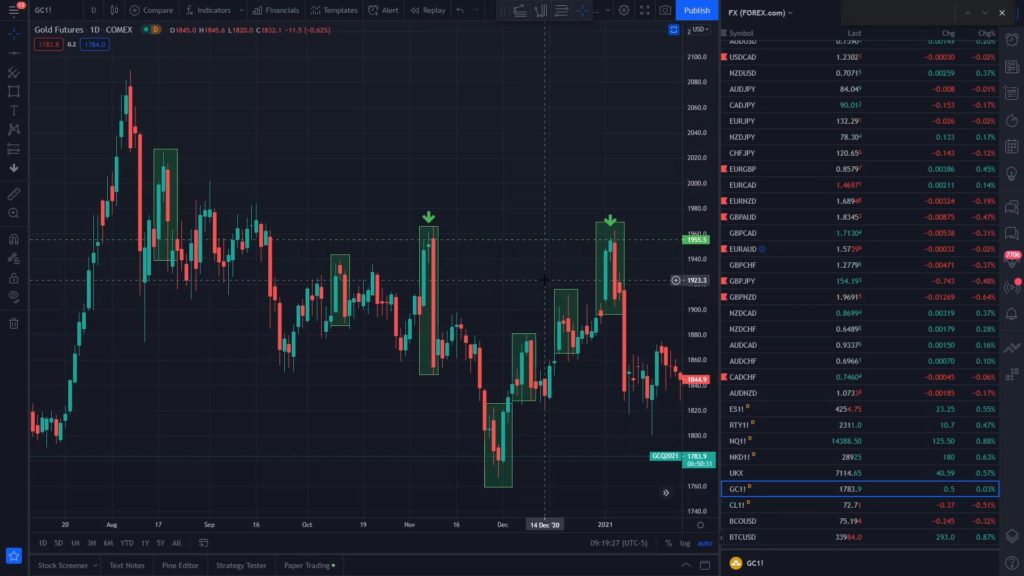
This video explores the most common, yet versatile Elliott Wave corrective patterns - the ABC flat.
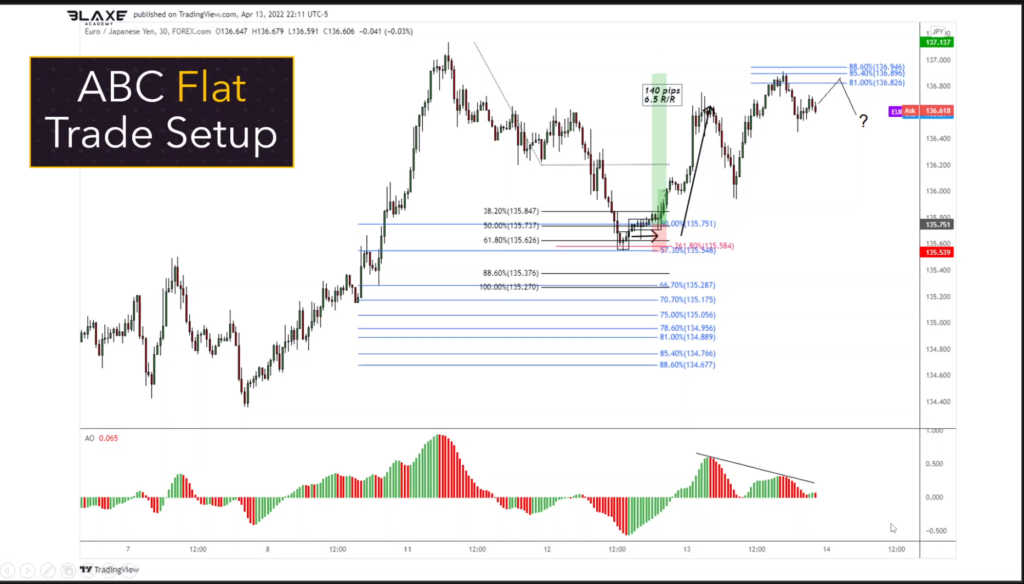
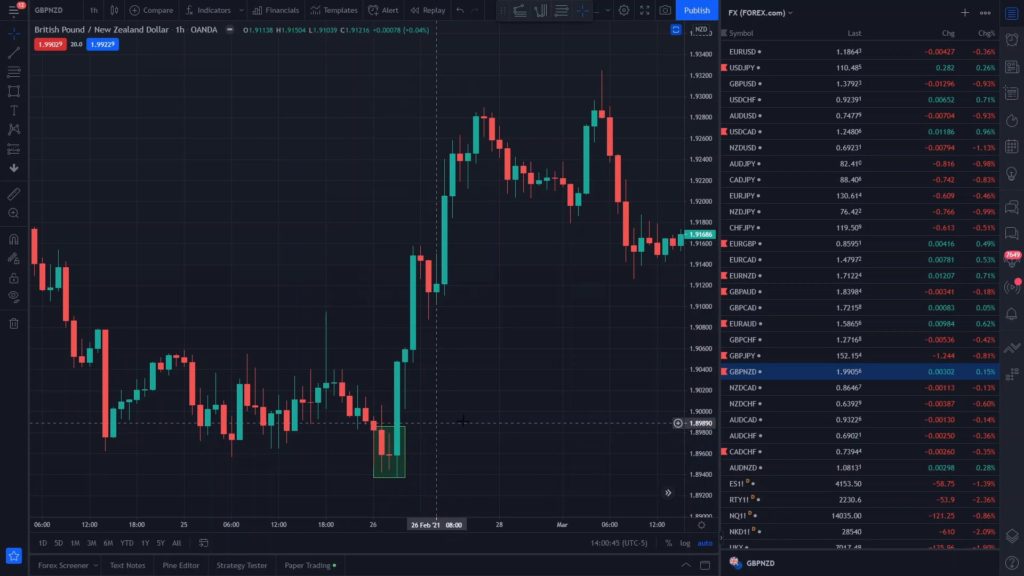
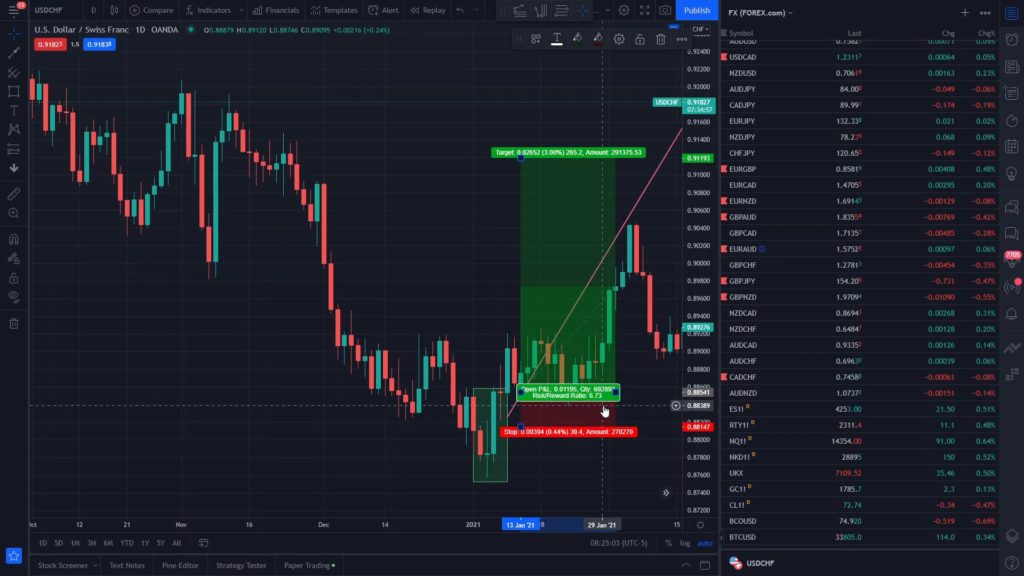
Here we review and analyze a flat trade setup executed by a professional trader on EUR/JPY

In this video, we cover one of the most versatile tools in technical analysis when it comes to analyzing charts - Fibonacci Retracements. See how Fibonacci retracements differ from support and resistance, and how you can use to find precise target levels.
We expand on trendlines and show you how to use them with other technical analysis tools to improve your efficiency and level up your trading game.
See how one of the most simplest technical analysis tools can help you determine the direction in market prices...one of the first steps to preparing your trade.
We discuss practical ways to use very important concepts from classical technical analysis – support and resistance. . ___________________________ You made it to the right place! But you need to subscribe to access this content. Start your Journey Here: [button size=’small’ style=” ...
We show more examples of practical applications of support and resistance, and combine other elements from technical analysis including trendlines and candlesticks.
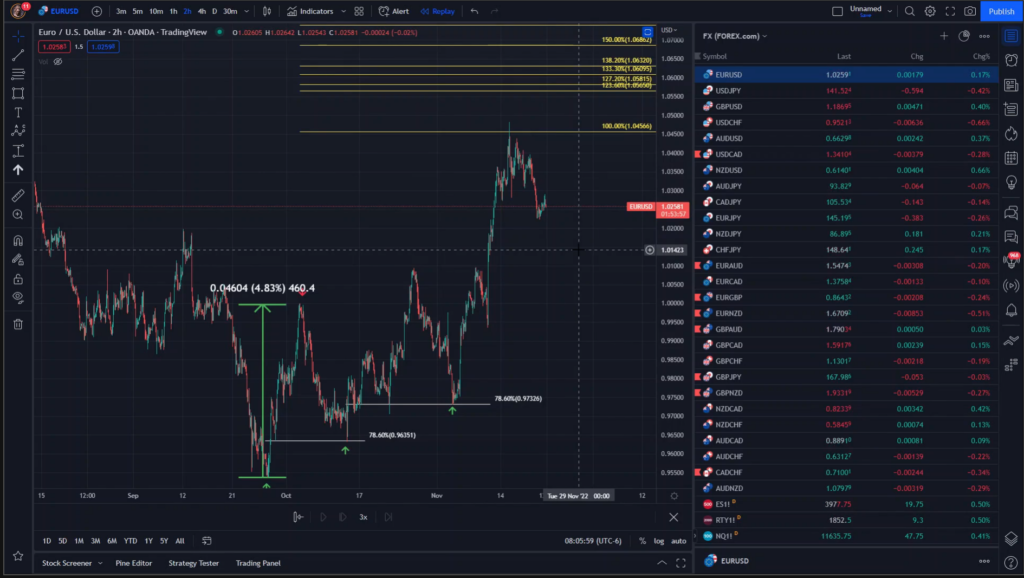
Learn how you can measure where the move is going next after seeing a pullback in the market with Fibonacci Projections

One of the simplest patterns, that indicates a bullish or buy signal. See how to spot it, and where to use this pattern for the best play.
Learn the major differences between a Hammer and Pin Bar Candlestick, and how you can use the Pin Bar for bullish and bearish signals.
One of our favorite candlesticks, see how the Doji neutral pattern can more likely indicate reversal, and why you should remain curious.
Learn more about two of the most versatile candlesticks - engulfing and partial engulfing patterns. You will see them across every market, and multiple timeframes.
One of the highest rated candlesticks in the playbook, the Morningstar is a bullish buy signal. See how the unique look of this pattern can indicate a powerful reversal dynamic
The opposite of the Morningstar, the Eveningstar is a bearish sell signal. But see how you can use the Eveningstar and Morningstar together as a powerful trading strategy.
Learn more about the shooting star, a simple one bar bearish candlestick pattern, that signals the market changing directions from a high.
Learn more about two of the most versatile candlesticks - engulfing and partial engulfing patterns. You will see them across every market, and multiple timeframes.